With d3js and a JavaScript Module you can easily create a bar chart or graph using a csv -- Comma Separated file.
Browsing through d3js documentation maybe you wished there was a pre-packaged module that generated a simple bar chart. The following barChartModule can easily allow one to simply create and display a HTML bar chart.
Creating a csv file
First you need a simple comma separated file with data to use with barChartModule. Here is a sample csv file opened in notepad:
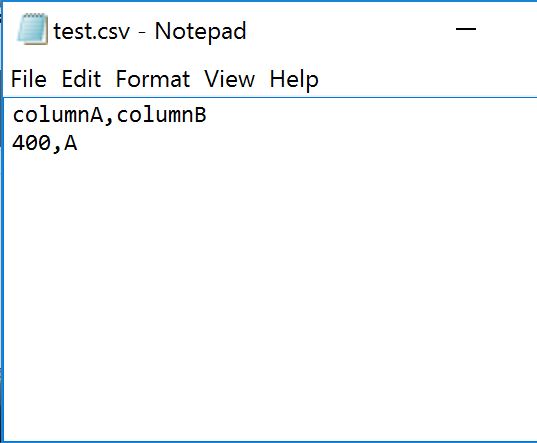
Here is a comma separated csv file in notepad. Notice columnA and columnB in first line.
CSV file requires column names in A1 and B1 as “columnA” and “columnB”.
To avoid complexity you can create a csv file using LibreOffice Calc libreoffice.org or MS Office Excel software. Be sure csv file has A1 and B1 columns as columnA and columnB.
 LibreOffice
Open Libre Office or spreadsheet software in your favorite office suite.
HTML page with bar chart
BarChartModule requires d3.v4.js from d3js.org included between head tags of your HTML document. Right below d3.v4.js inclusion, please include barChartModule.js.
Here is a complete html document. Requires d3.v4.js and barChartModule.min.js script includes.
<!DOCTYPE html>

<html>

    <head>

        <title></title>

        <meta charset="utf-8">

        <script src="js/d3.v4.js"></script>

        <script src="js/barChartModule.min.js"></script>

    </head>

<body>


     <div id="MyChartOne">


     </div>


<script>


    barChartModule.createChart("data/test.csv", "#MyChartOne", "400px");


</script>

</body>

</html>
You only need a div tag with id selector of your choice. In this example id is set to “MyChartOne”.
     <div id="MyChartOne">


     </div>
Before the closing body tag, you can run createChart function from barChartModule, inside script tags.
Properties of createChart function allow for setting csv file location, id tag of div to place chart, and height of displayed div frame around bar chart.
barChartModule.createChart("location-of-csv-file-relative-to-html-document", "#div-id", "height in px");
Other look and feel may be styled using standard ways of styling HTML documents.
Running graph on local computer
Due to loading data from a csv file asynchronously, a simple http server is required. To use this module also requires a simple http server such as Apache. You can also try this on a free web hosting account from your domain registrar.
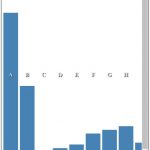
Here is how chart looks
 Bar Chart generated with module
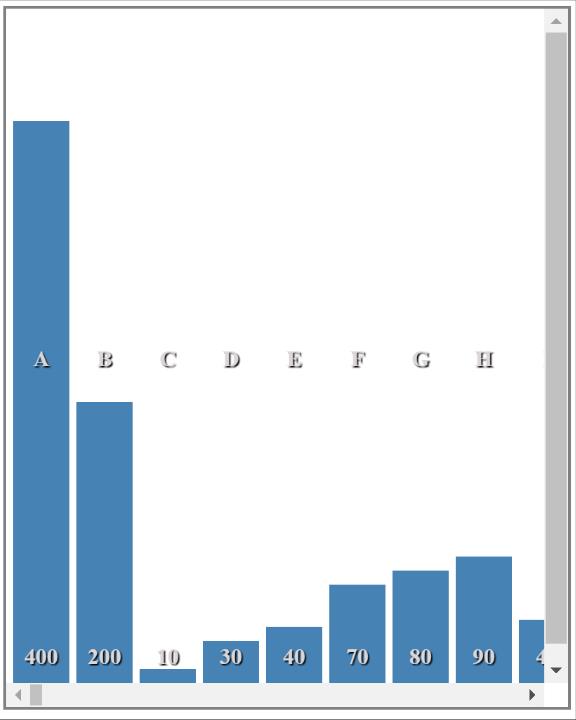
Here is how bar chart will look with more rows in csv file.
Since this is a module, one can display multiple charts and graphs.
    <div id="MyChartOne" style="float:left;height:200px">


     </div>


     <div id="MyChartTwo" style="float:left;margin-left: 70px;height;200px">


     </div>


<script>

    var chartOne = barChartModule.createChart("data/test.csv", "#MyChartOne", "400px");

    var chartTwo = barChartModule.createChart("data/test.csv", "#MyChartTwo", "400px");

    chartOne;

    chartTwo;

</script>
Generating a bar chart from csv file with over 900 rows
 Bar Chart generated with module
Here is how bar chart will look with many more rows in csv file.
Here is barChartModule.js
You can copy barChartModule below and save as barChartModule.min.js. Use with your comma separated data in your web hosted html documents.
//Author: Zeshan B.

//Date: May, 17, 2017

//Dependency: d3 Version 4

//Version: 1.0v

var barChartModule=function(t){function e(e,s,a){var c={loadStatus:"data not loaded"};switch(Boolean(void 0!==s)){case!1:console.log("chartContainer id selector not defined")}switch(Boolean(void 0!==a)){case!1:console.log("chartHeight in px not defined")}t.csv(e,function(t,e,l){for(chartData=e.map(function(t){return{columnA:t.columnB,columnB:t.columnA}});chartData;)return chartData}),setTimeout(function(){c=chartData,l(c,s,a)},400)}function l(e,l,s){var a=t.select(""+l).append("div").attr("class","chart").style("display","block").style("height",""+s).style("width","200px").style("z-index","1");a.select(".chart").append("div"),t.select(""+l).select(".chart").insert("div").attr("class","colval"),t.select(""+l).select(".chart").insert("div").attr("class","colname");var s,c=t.select(""+l).select(".chart").select(".colval").insert("span"),o=t.select(""+l).select(".chart").select(".colname").insert("span"),n=(t.select(".chart"),+s.substr(0,3)),r=(t.selection(".chart").style("width").valueOf().substr(0,2),+t.selection(".chart").selectAll("div")._groups[0].length);a.selectAll("div").select(".chart").data(e).each().enter().append("div").attr("class",function(t){return t.columnA.replace(/\s/,"-")+" bar"}).style("width","40px").style("background-color","steelblue").style("margin-top",function(t){var e;return t.columnB>=n?e=0:t.columnB<n&&(e=n-t.columnB),e+"px"}).style("height",function(t){return t.columnB>=n?100+"%":t.columnB+"px"}),a.select(".colval").style("display","block").style("float","left").style("position","relative").style("width","100%").style("height","40px").style("bottom","-113%").style("left","0").style("z-index","1"),a.select(".colname").style("display","block").style("position","relative").style("width","100%").style("height","40px").style("top","50%").style("left","0").style("z-index","1"),c.selectAll("span").data(e).enter().append("span").attr("class","colval").text(function(t){return""+t.columnB}).style("display","block").style("width","40px").style("height","30px").style("color","#dcd7d7").style("text-shadow","1px 1px 1px black").style("position","relative").style("margin-left","5px").style("float","left"),o.selectAll("span").data(e).enter().append("span").attr("class","colname").text(function(t){return""+t.columnA}).style("position","relative").style("display","block").style("color","#dcd7d7").style("text-shadow","1px 1px 1px black").style("width","40px").style("height","30px").style("margin-left","5px").style("float","left"),a.selectAll("div").style("float","left").style("text-align","center").style("color","#fff").style("font-weight","bold"),a.selectAll(".bar").style("margin-left","5px"),t.select(l).style("display","block").style("margin-left","auto").style("margin-right","auto").style("height","inherit").style("width",""+s).style("overflow-x","auto").style("overflow-y","auto").style("border-style","solid").style("border-color","gray").style("border-width","2px"),r=+t.selection(".chart").selectAll("div")._groups[0].length,a.style("width",55*r+"px")}return{createChart:function(t,l,s){e(t,l,s)}}}(d3);
References
"d3js selection" (https://github.com/d3/d3/blob/master/API.md#selections-d3-selection)
"d3js csv" (https://github.com/d3/d3-request/blob/master/README.md#csv)
"Learning JavaScript Design Patterns"(http://shop.oreilly.com/product/0636920025832.do)